Back in 2016 I mentioned that I started tracking my laptop battery statistics on my then new MBP. Well, now that laptop has reached EOL, with its batteries getting swollen and the fan often running a bit fast, probably due to all the dust inside it.
While I didn’t have any complaints about the overall performance of my trusty old laptop, after 5-6 years of everyday use, I felt it was time to upgrade. And it didn’t feel safe with the batteries swelling either! I might look into refurbishing it, if the cost of new batteries aren’t too ridiculous.
Anyway, as I mentioned in my previous battery blog post, I started logging battery statistics once every half hours, on a simple cron job, with a simple little script.

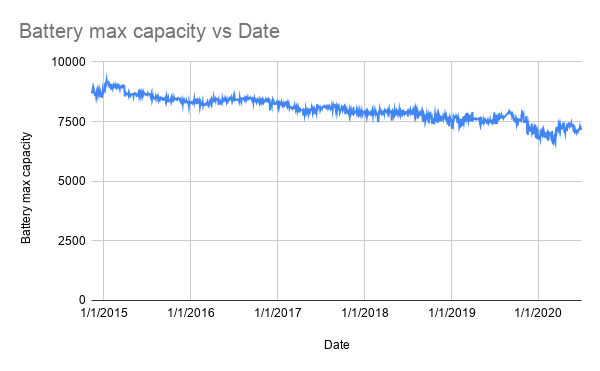
So let’s take a look at 5-6 years of data, starting with battery capacity:

Got to say that I’m impressed with the overall trend here. I was expecting it to have a stronger downwards trend, considering age and usage, but also compared to the number of hours of use I got when running on batteries. I guess maybe I incorrectly remember how long I initially could run it on batteries when it was new.
What about cycle count then?

Here we see the battery cycle count in red, using the y-axis on the right, together with the accumulated hours of use. As expected these follow each other.
I’ve seen some state that Apple expects a battery to retain 80% of it’s capacity at 1000 cycles. I’m not close to 1000 cycles, but compared to the slow downwards trend on the capacity chart, that’s maybe not unreasonable. However, with the swelling going on, I wouldn’t be comfortable trying to get to 1000 cycles.
I’ve published all the charts and raw data on Google Sheets, so feel free to look around. The only other chart I considered including was one showing average and median use by day. But, as it turns out, these were rather equal, with a little peak on Tuesdays. These aren’t maybe that insightful anyway, as I often just leave my laptop running.